Modernization and Scalability Enhancements for Sub‐Nanosecond Accuracy Diagnostic Cross Timing for Use at Current and Future NNSS Testbeds
Project # 23-049 | Year 1 of 2
Daniel Championa, Andrew Robinsonb, Ajanaé Williamsa, Caleb Dahlkec, Nick Eisenbergb
aNavada National Security Sites, bNational Lab: LLNL, cUniversity of Arizona
This work was done by Mission Support and Test Services, LLC, under Contract No. DE-NA0003624 with the U.S. Department of Energy, the NNSA Office of Defense Programs, and supported by the Site-Directed Research and Development Program. DOE/NV/03624–1937.
Abstract
PULSE will soon have three simultaneously active experiment testbeds, each with multiple diagnostics (optical, radiographic, radiance, etc.). On each testbed, the quantity of diagnostic points can number in the hundreds (e.g., photonic Doppler velocimetry). The diagnostic scale at PULSE requires the development of a modern and scalable approach to diagnostic cross-timing (XT) to accelerate experiment execution across testbeds and facilitate multiple teams of scientists and engineers concurrently assessing XT. This solution will replace existing practices that are currently performed manually with dozens of spreadsheets and documents using a human-in-the-loop machine-assisted process with version control. The project will also investigate innovative and modern approaches to a scalable XT analysis platform that will result in a persistent cross-timing capability field-able at PULSE and other multi-diagnostic testbeds (at the NNSS and partnering NNSA testbeds).
Background
XT analysis on subcritical experiments is done using manual spreadsheet analysis. Analysts transform timing diagrams and measurements into spreadsheets and arithmetic tests to verify XT on each diagnostic point (manipulation of 10s of spreadsheets with 1000s of measured values). Analysts perform this without structured version control amid multiple sources of truth. Databasing, structured version control, and analytic assistance are being produced by the project and enable many XT methods that currently reside in the minds of a limited quantity of personnel with expert knowledge in this area to be implemented within the XT analytic platform.
XT analysis is an integral and critical component of past, present, and future subcritical experiments. Innovating in this area as proposed in this project will provide present and future subcritical experiment programs with the scalability and increased tempo in this traditionally time-consuming analysis effort. By utilizing the SDRD program for this work, a modernized trans-experiment capability is being developed and tailored to PULSE-scale/DOE-scale multi-diagnostic testbeds that will provide a foundational and enabling diagnostic capability for the next decade and beyond.
.
Technical Approach
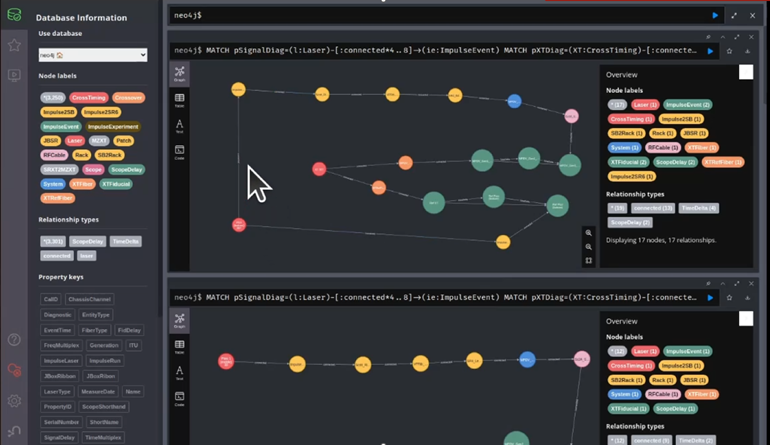
This project is developing a modern approach to sub-nanosecond accuracy XT for large-scale multi-diagnostic testbeds focusing on PULSE testbeds and subcritical experiments. The project foundation is the development and population of a graph database that holds thousands of signal delay measurements and other datapoints required for comprehensive XT analysis. This includes signal-delay and system-delay measurements corresponding to all discrete components of the signal and XT paths of the scientific apparatus (drawn from each diagnostic, screen room, and timing and firing systems). Utilizing graph database technology enables the accurate and user-intuitive representation of the topological structure present in a multi-diagnostic testbed. This graph representation of XT data also provides a version-controlled solution that can serve as a single source of truth for timing information and inform one-line creation.
The project is developing four primary software/database/process components:
- XT database: Graph database housing XT data from all diagnostics and timing and firing with backups, version-control, and analytic application program interface (API).
- User interface: Browser-based or standalone graphic user interface (GUI) capability to enable diagnostic and timing and firing personnel to provide updates and view current XT data and summaries.
- Update process: Hierarchical update/commit review process integrated into the database and user interface to allow for senior XT personnel to organize, document, and approve updates from multiple sources.
- XT analytics: autonomous or semi-autonomous near-real-time XT analytics for XT dashboards and summaries and for performing XT root-cause-analysis.
The graph database allows for the accurate graph representation of one-line signal delay information in a structured database or software solution. The user interface will be a major focus area of work to allow for a wide range of users to interact with the capability. For the update process in (3), several stand-alone version control solutions (Git, mercurial) are being evaluated and integrated into the project. The analytics in (4) are being implemented in Python through an API that provides machine access to the current and historical XT data stored in the database. To date, the real-time analytics have taken the form of real-time configuration management validation applications, but soon more analytics will be deployed that run at cadencies determined by the XT analyst depending on the purpose of the analytics (daily, once per diagnostic run, once per database update, ad-hoc, etc.).
Results and Technical Accomplishments
In the first year of this project, the PULSE.05 testbed was selected and utilized as the testbed for the timing database and analytics. Work began with the full accounting and identification of each delay-introducing discrete component of the scientific apparatus. This included over 3,000 components and constituted a major milestone in Q1/Q2. That work was facilitated by adoption and construction of an automatic data entry workflow which consisted of applying barcode labels to each end of every diagnostic fiber optic cable and performing scanning operations to record the topological data of the apparatus. The automatic data entry also allowed for the accurate and empirical collection of configuration change data as the apparatus evolves during the course of an experiment. The timing databased was fully populated for the Nimble series experiments in Q3 of FY 2023, and database queries that replace spreadsheet-based cross timing analysis operations were developed through Q3 and Q4 showing agreement with legacy methods. The first real-time analytics were demonstrated as early as Q2 FY 2023, with a real-time configuration change analytic that allowed an engineer or fiber technologist to verify correct fiber configuration change as the changes were being made to minimize and identify errors in real-time. The first Python-based GUI interface was demonstrated in Q4, allowing a user to perform a common timing database operation without the need for database query language familiarity.
Conclusions and Path Forward
In the second year of the project, interfaces will be constructed using Python and Django to perform all common timing database operations without the need for query language experience. Further investment in the performance and implementation of the automatic data entry methods will be performed to adapt that method to all potential testbed circumstances. The timing database will also continue to pace the legacy spreadsheet based methods to develop comparisons between the new and old approach for both Nimble experiments in FY 2024. A final comparative analytics of the two approaches will be developed in Q3 FY 2024. In the second year, the timing database approach will be investigated and begin to be applied to a new testbed at LLNL and/or at another PULSE testbed.