
Utilizing Machine Learning to Automate Linear Induction Accelerator Beam Tuning
Project # 23-040 | Year 2 of 2
Daniel Claytona, Nicholas Eisenbergb, Jesse Adamsb, Sean Brecklinga,
Rachel Gilyardb, Jeremy Faita
aLos Alamos Operations (LAO), bNevada National Security Sites (NNSS)
This work was done by Mission Support and Test Services, LLC, under Contract No. DE-NA0003624 with the U.S. Department of Energy, the NNSA Office of Defense Programs, and supported by the Site-Directed Research and Development Program. DOE/NV/03624–1908.
Abstract
This project began with the purpose of developing an algorithm to predict component failure using data from non-invasive beam diagnostics and accelerator magnet controls on linear induction accelerators. We planned to collect data at the Dual Axis Radiographic Hydrodynamic Test (DARHT) facility, but the required data were never obtained. We obtained a historical dataset instead, consisting of DARHT machine component statistics, but not the actual component data itself. Through an extensive search of this curated dataset, we can present possible areas of interest for future work even though the original goal of predicting component failure was not successful.
Background
We did not accomplish the originally proposed goal of utilizing machine learning to predict component failure due to a lack of available data. In particular, a shot log that depicted which shots had component failures was unavailable. This removes the possibility of conducting any type of supervised learning and limits the analysis to non-supervised techniques such as clustering. The lack of historical data is due to the fact that the DARHT operators keep this information in handwritten logbooks. In the future, it may be possible to obtain this data by digitizing and processing these logbooks, a task that was too labor-intensive for the scope of this work.
With regards to appending and improving the current dataset, this goal was made challenging as there was no access to the actual machine component data. In place of the actual machine sensor output data, only statistics of the aggregate data were available. In other words, for a specific machine component, we only had access to the mean, standard deviation, etc. of the component’s output for all shots where this data was not missing.
This essentially reduces each component’s output to a single value. The true output of each component is a time-series consisting of thousands of measured values, thus massive amounts of information are lost by reducing this to a single statistic, further adding a great deal of restriction when tasked to create additional and meaningful features. Those features are mathematical summaries tailored to specific data, which can be used to differentiate outliers.
Technical Approach
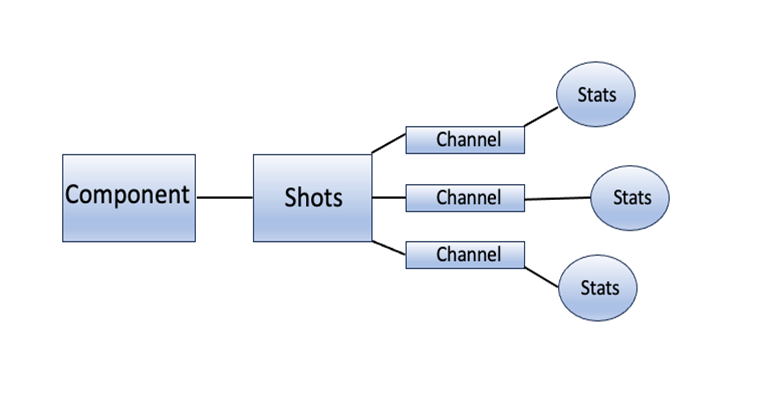
The dataset we were presented with was structured in the following way. First, there was a series of machine components, such as a cell voltage monitor, pulse forming network, cell solenoids, etc. Second, each component was further associated with a specific shot and channel, where the channels correspond to the position along the accelerator. There were 74 channels in total and upwards of 18,000 shots, however much of the data were missing and it was not uncommon for a component to not have data recorded for 25% of the shots. Third, each shot and channel of a component was further associated with a set of statistics that served to describe the recorded shot data of the component (see figure).
In the first year of the project, we attempted methods of clustering to find any patterns within the data. Clustering algorithms will always produce a result, so the quality of the result needs validation with well-kept historical records. Because of our lack of access to the handwritten shot logs, we could not evaluate the validity of any of our clustering results. In the second year, we were presented with a series of test cases that were written by our colleagues at Los Alamos National Laboratory (LANL). Essentially, these cases were rules to be tested against the data with the hope of identifying anomalies.
One example test case reads: “Make sure all Pulse Forming Network (PFN) currents fire at approximately the same time. Program a trip for 20% of the PFN current. If this occurs within 1 μs of the proper time, we can consider it to be working.” Through an exploratory data analysis phase, we quickly learned that this condition couldn’t be solved directly because it suggests that the referred start times are normally distributed, and we found that this was not the case. After discussion with our LANL colleagues, we were advised to group each shot according to its voltage and then apply the issue within each voltage subgroup. Within these voltage subgroups, the start times seemed to follow a bell-shaped distribution.
We developed a Python script to assess the issue against our dataset. This script allows the user to input a component and a cell channel, and in return, the script will very quickly parse the dataset and return the shot numbers that were deemed anomalous per the issue. While this script works quite well and handles the issues in question, there is no way to check whether the issue itself leads the user to find actual shot failures. In other words, the user can take the issue, apply the Python script, and receive a list of shot numbers that are labeled anomalous, but without a dataset of labeled historical data, none of these returned anomalous shots can be verified.
Results and Technical Accomplishments
Predicting component failure using methods of machine learning is not an easy task for many reasons. Substantial amounts of historical data must be presented, and this data must be labeled with examples of what needs to be predicted. In this project, this was not the case, so success with machine learning is unlikely until more data can be obtained.
However, we were able to create a tool that can quickly parse the dataset and return anomalous shots according to each of the issues presented by our colleagues at LANL. Again, without a labeled dataset, we are unable to further investigate what makes these shots anomalous.
Conclusions and Path Forward
This project ends this fiscal year, and while the original goal of the project was not met, we do not believe that the task is impossible. However, more data needs to be collected, and more importantly, this data needs to be clearly labeled and documented. When a labeled dataset is constructed, then the future researchers will have a much better chance of creating a model that can be successful in predicting component failure of linear induction accelerators.
Back to Accelerator Beam Science and Target Interactions Index