
Measurement of Dynamic Melting and Re-Crystallization of Shocked Metals
Project #: 22-033 | Year 2 of 3
R. Jason Scharff, Brandon La Lone, Gerald Stevens, Matt Staska, Ruben Valencia, William Turley
Nevada National Security Site (NNSS)
Executive Summary
This project is exploring the use of velocimetry, radiance, and reflectance techniques to measure time‐resolved pressure-temperature pathways of a shock‐compressed metal. This was done to support recent and future pyrometry experiments for measuring the dynamic melting and re-crystallization of shocked metals.
Description
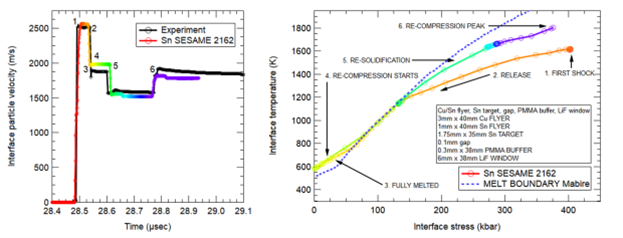
We have developed a shock-release-recompression experiment and, thus far, successfully measured interface particle velocities and radiance of tin melting and recrystallization under dynamic conditions. We have performed a single scoping experiment based on our initial computational design of the experiment using CTH (a code family for multidimensional continuum mechanics analysis). To achieve the melt and refreeze of a tin target, we have created a multi-layered target assembly from a tin sample/vacuum gap/polycarbonate buffer/LiF anvil. This target is impacted at 2.5 km/s with a copper/tin planar flyer launched with the Special Technologies Laboratory (STL) powder gun. The included figure (left panel) depicts the interface particle velocity (black trace) measured by photonic Doppler velocimetry (PDV) looking through all of the transparent layers to the back surface of the tin sample. This result is consistent with simulated results (color trace) from CTH simulations. The right panel illustrates the CTH simulated trajectory in pressure-temperature phase space that the tin sample takes. From our simulation, we can infer that the tin sample is shocked to ~400 kbar (1600 K) on the principal Hugoniot. When the shock wave reaches the rear surface/vacuum interface, the rarefaction releases the tin sample to 0 kbar and ~600 K, resulting in a fully melted state. Once the vacuum gap closes, the tin sample recompresses back to the solid-liquid phase boundary. The recompression process eventually pushes the tin sample back into the solid phase. It should be noted that the point at which the sample transitions back into the solid phase in pressure-temperature space is concurrent with the observation of a perturbation in the measured particle velocity time history. In addition, our radiance measurements were not sufficient to fully determine the pressure-temperature profile of the loading conditions as they evolved during the experiment. This work will continue; our next phase is to measure radiance and emissivity simultaneously.
Conclusion
We have designed and successfully executed an experiment to dynamically melt a tin sample followed by recrystallization upon recompression. We have used CTH to model the expected behavior with our measured particle velocity time histories matching the simulation with great agreement. Moving forward, we plan to make similar measurements on other tin samples and measure the radiance and emissivity simultaneously. This will allow us to directly map the recompression pressure-temperature path of shock-melted tin.
Mission Benefit
Shock‐induced phase transformations are of seminal importance to the weapons physics community. The dynamic trajectory of a nuclear primary prior to maximum compression is quite complex. Materials in the primary are subjected to complex loading conditions composed of multiple shock compression waves, rarefaction waves, and ramp compression waves. As a result, those materials will traverse a range phase space that can induce solid‐solid and solid‐liquid phase transformations. Decades of research have been devoted to identifying solid‐solid and solid‐liquid phase boundaries in a host of materials spanning from hydrogen to plutonium. Our technique can be rapidly adapted to TA‐55 and Joint Actinide Shock Physics Experimental Research (JASPER) for special nuclear material (SNM) measurements and can provide accurate and time‐resolved temperature and pressure data for determining if and where the re‐solidification occurs. This will more than likely be the preferred tool for directly measuring the phase behaviour of SNM at TA‐55, JASPER, and U1a.
This work was done by Mission Support and Test Services, LLC, under Contract No. DE-NA0003624 with the U.S. Department of Energy. DOE/NV/03624–1619.
Return to Dynamic Experiment Diagnostics
Go to SDRD Annual Report Index
Return to SDRD Homepage